A water park can be a large-scale entertainment and leisure business in India, but its financial success depends on much more than selling entry tickets. Land cost, project size, construction, water rides, visitor capacity, location, seasonality, operating expenses and additional revenue sources all influence the final profitability.
A proper water park business plan should therefore answer four major questions:
- How much investment is required?
- How will the park generate revenue?
- What profit can the business potentially make?
- How long can it take to recover the investment?
Industry and project-report sources show a wide range of investment estimates because water parks differ significantly in scale. For example, one current industry source estimates a mid-scale project at ₹30 crore–₹120 crore, while a separate project report for a 10-acre amusement-park-cum-water-park gives a capital investment estimate of ₹16.62 crore. These differences demonstrate why a project-specific feasibility study is essential.
Water Park Business Model in India

The basic business model is straightforward:
Investment → Build Infrastructure → Attract Visitors → Generate Multiple Revenue Streams → Control Operating Costs → Recover Capital
However, a successful water park should not depend entirely on entry tickets.
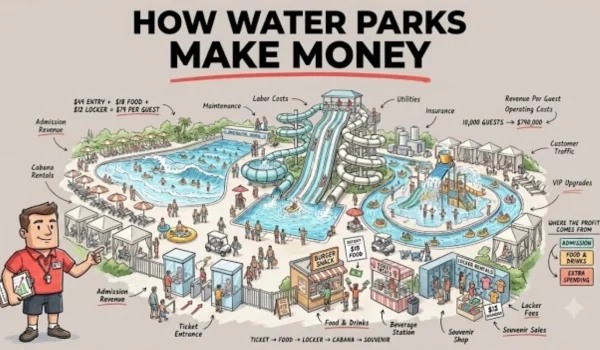
Potential revenue sources include:
- Entry tickets
- Food and beverages
- Lockers
- Parking
- Merchandise
- Premium attractions
- Private parties
- Corporate events
- School and group bookings
- Advertising and sponsorships
- Premium seating or cabanas
Industry sources also identify food courts, corporate events, school tours, merchandise, lockers and parking as important supplementary revenue streams.
Estimated Water Park Investment Cost
The total project cost depends on the size and location of the park.
A broad planning framework can look like this:
| Expense | Indicative Investment |
| Land | ₹1 crore–₹15+ crore |
| Site development & construction | ₹2 crore–₹10+ crore |
| Water rides | ₹1 crore–₹8+ crore |
| Pools & water systems | ₹50 lakh–₹3+ crore |
| Electrical & utilities | ₹50 lakh–₹2 crore |
| Safety infrastructure | ₹15 lakh–₹75 lakh |
| Changing rooms & visitor facilities | ₹20 lakh–₹1 crore |
| Parking & landscaping | ₹20 lakh–₹1.5 crore |
| IT, CCTV & ticketing | ₹10 lakh–₹50 lakh |
| Licences & professional fees | ₹10 lakh–₹50 lakh |
| Pre-launch marketing | ₹10 lakh–₹50 lakh |
| Initial working capital | ₹25 lakh–₹1 crore |
These figures are indicative. Land ownership, location, park capacity, ride selection and construction specifications can change the project budget substantially.
For example, one published 10-acre amusement-park-cum-water-park project report estimates land and building at ₹9.46 crore, plant and machinery at ₹5.96 crore and total capital investment at ₹16.62 crore.
How Does a Water Park Make Money?
Entry tickets are normally the primary revenue source, but additional spending by visitors can materially increase the average revenue per visitor.
- Entry Tickets
Suppose:
- Average ticket price = ₹800
- Average visitors per operating day = 900
- Operating days = 240
Then:
900 × ₹800 × 240 = ₹17.28 crore annual ticket revenue
This is only an illustration. Actual ticket prices and visitor numbers vary substantially by location, season, park quality and competition.
A current industry example uses ₹800 average visitor spending and 900 daily visitors over 240 operating days to illustrate annual revenue of ₹17.28 crore before considering other revenue streams.
- Food and Beverages
Food and beverages can become an important secondary revenue source.
A park can operate:
- Restaurants
- Food courts
- Snack counters
- Cafés
- Ice-cream outlets
- Beverage counters
The objective is to increase average visitor spending, rather than relying only on ticket prices.
- Lockers and Parking
Visitors may pay separately for:
- Lockers
- Parking
- Premium storage
- Changing facilities
Although individual charges may be small, high visitor volume can make these meaningful supplementary revenues.
- Events and Group Bookings
Water parks can also target:
- School trips
- Corporate outings
- Birthday parties
- Family functions
- Private events
- Group bookings
These bookings can help improve weekday utilization, particularly when normal weekend demand is stronger.
- Merchandise
Merchandise can include:
- Swimwear
- Towels
- Caps
- Water bottles
- Toys
- Souvenirs
- Branded products
Illustrative Annual Revenue Model
Consider a hypothetical medium-sized water park.
Assume:
- 1,000 average visitors per operating day
- 240 operating days
- Average ticket = ₹800
- Average additional spending per visitor = ₹200
Total visitors:
1,000 × 240 = 2,40,000 visitors
Ticket revenue:
2,40,000 × ₹800 = ₹19.20 crore
Additional visitor spending:
2,40,000 × ₹200 = ₹4.80 crore
Potential total operating revenue:
₹24 crore per year
This is an illustrative model—not a prediction. Actual results can be much lower or higher depending on visitor footfall, pricing, seasonality and the park’s facilities.
Water Park Operating Expenses
Revenue alone does not determine profitability.
Major operating expenses can include:
- Employee salaries
- Electricity
- Water
- Chemicals
- Ride maintenance
- Pool maintenance
- Cleaning
- Security
- Lifeguards
- Insurance
- Marketing
- Repairs
- Administrative expenses
- Property-related costs
- Food inventory
- Technology and ticketing systems
Electricity and water-related systems can be particularly important because pumps, filtration and treatment systems operate continuously during the operating season.
Water Park Profit Calculation
Suppose a hypothetical park generates:
Annual Revenue = ₹24 crore
Now assume total operating expenses are:
₹16 crore
Then:
Operating Profit = ₹24 crore − ₹16 crore
Operating Profit = ₹8 crore
Operating margin:
₹8 crore ÷ ₹24 crore × 100 = 33.3%
This does not necessarily mean the owner’s final net profit will be 33.3%.
Interest, depreciation, taxes, financing costs and other expenses need to be considered before calculating net profit.
Current industry material has cited operating/EBITDA margins in the 25%–40% range under favourable conditions, while another source gives a 22%–30% net-margin estimate. Such figures should be treated as industry estimates rather than guaranteed outcomes.
ROI Calculation
Return on Investment can be calculated using:
ROI = Annual Profit ÷ Total Investment × 100
For example, assume:
Total Investment = ₹20 crore
and:
Annual operating profit = ₹5 crore
Then:
ROI = ₹5 crore ÷ ₹20 crore × 100
ROI = 25%
However, this simplified calculation should not be confused with a full project-finance return calculation.
A professional feasibility study should also consider:
- Debt
- Interest
- Depreciation
- Taxes
- Working capital
- Replacement costs
- Expansion expenditure
- Cash flow
- Asset value
Break-Even Point
Break-even means the point at which total revenue is sufficient to cover the relevant costs.
For a water park, break-even can be measured through:
- Number of visitors
- Revenue
- Capacity utilization
- Operating days
For example, if annual fixed and semi-fixed costs are ₹8 crore and the average contribution per visitor is ₹400:
Break-even visitors = ₹8 crore ÷ ₹400
= 2,00,000 visitors
This means the park would need approximately 2 lakh visitors under these assumptions to cover those costs.
The actual calculation should also account for variable expenses and multiple revenue streams.
Payback Period
Payback period indicates how long it may take to recover the initial investment from project cash flows.
For example:
Initial Investment = ₹20 crore
Average annual cash generation = ₹4 crore
Approximate simple payback:
₹20 crore ÷ ₹4 crore = 5 years
But actual payback can take longer because the first few years may have lower visitor numbers, financing costs, maintenance expenses and other cash requirements.
Published industry estimates currently vary considerably, with some sources suggesting approximately 5–7 years for larger projects and others giving longer periods.
Seasonality: A Major Factor
One of the most important issues in a water park business is seasonality.
Visitor demand can be much stronger during:
- Summer holidays
- School vacations
- Weekends
- Public holidays
- Festival periods
Demand may be significantly lower during colder or rainy periods depending on the location.
Therefore, annual profitability should never be calculated simply by multiplying peak-season daily visitors by 365 days.
A realistic business plan should divide the year into:
Peak Season + Shoulder Season + Off Season
and estimate visitor numbers separately for each period.
How to Improve Water Park Profitability
A water park can improve its financial performance by focusing on both visitor volume and visitor spending.
Important strategies include:
Increase Average Revenue Per Visitor
Instead of increasing ticket prices aggressively, the park can increase spending through:
- Food
- Lockers
- Parking
- Merchandise
- Premium facilities
- Events
Improve Weekday Footfall
Special packages can target:
- Schools
- Colleges
- Corporates
- Tour groups
- Local organizations
Control Operating Costs
Efficient:
- Pumps
- Filtration
- Water treatment
- Electricity consumption
- Staffing
- Maintenance
can significantly affect operating margins.
Build a Strong Local Catchment
A water park does not necessarily need to depend entirely on tourists.
A strong customer base within a practical driving radius can provide repeat and weekend visitors.
Major Risks in the Water Park Business
Before investing, entrepreneurs should consider several risks.
High Initial Investment
Water parks require substantial upfront capital for land, construction, rides and infrastructure.
Seasonality
Revenue can fluctuate considerably throughout the year.
Safety Risk
Accidents can create financial, legal and reputational consequences. Safety systems, trained lifeguards, maintenance and operating procedures are therefore critical.
Competition
A new park may face competition from existing water parks, amusement parks, resorts and other entertainment destinations.
Maintenance
Water rides, pumps, filtration systems and pools require regular maintenance and eventual replacement.
Location Risk
A poorly accessible location can significantly reduce visitor numbers even if the park itself is well designed.
Is Water Park Business Profitable?
A water park can be profitable, but profitability is not automatic.
The most important factors are:
Location + Visitor Footfall + Pricing + Average Spend + Operating Cost + Seasonality + Safety
A park with high visitor numbers but poor cost control may still struggle financially. Similarly, a premium park with strong per-visitor spending can potentially generate attractive returns with fewer visitors.
Current industry sources indicate strong interest in Tier-2 and Tier-3 markets, but location-specific demand research is essential before making a major investment.
Final Conclusion
A water park business plan should go far beyond calculating construction costs.
A proper financial model should include:
- Total project investment
- Land and construction cost
- Ride and equipment cost
- Working capital
- Annual visitor projections
- Ticket pricing
- Additional revenue per visitor
- Operating expenses
- EBITDA
- Net profit
- Break-even point
- ROI
- Payback period
- Sensitivity analysis
Most importantly, never use a single profit or ROI percentage as the basis for investment. Water parks are highly dependent on location, seasonality, visitor volume and capital structure.
Before investing, prepare a detailed feasibility study and project report based on the actual site, land cost, expected visitor catchment, competition, project capacity and financing structure. A professional project report should also include projected cash flows, balance sheets, debt-service calculations, break-even analysis and sensitivity scenarios. Project-report frameworks used in the industry commonly include these financial components.