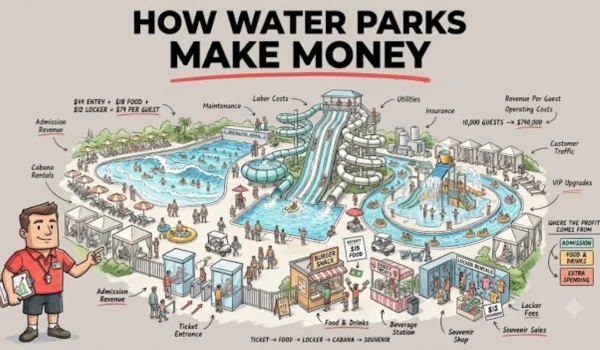
A water park can generate attractive revenue in India, particularly during the summer and holiday season. However, the profitability of a water park depends on much more than ticket sales. Visitor footfall, ticket pricing, food and beverage sales, operating costs, maintenance, seasonality, land cost and financing all have a direct impact on the final profit.
For a new investor, three numbers are particularly important:
- Profit Margin
- ROI (Return on Investment)
- Payback Period
Industry estimates vary considerably. One current Indian industry source puts potential net margins for a well-managed water park at around 22%–30%, while another current source cites 30%–40% EBITDA margins and a 5–7 year payback period. These should be treated as indicative industry estimates rather than guaranteed returns.
How Much Profit Can a Water Park Make in India?
There is no fixed profit figure because water parks can range from small local facilities to large destination resorts.
Consider a hypothetical medium-sized water park with:
- 1,000 visitors per operating day
- 240 operating days per year
- Average ticket price: ₹800
- Average additional spending per visitor: ₹200
Annual visitors would be:
1,000 × 240 = 2,40,000 visitors
Ticket revenue:
2,40,000 × ₹800 = ₹19.20 crore
Additional revenue:
2,40,000 × ₹200 = ₹4.80 crore
Therefore, illustrative annual revenue would be:
₹24 crore
This is only a financial model. Actual revenue can be significantly different depending on the park’s location, pricing, capacity and visitor demand.
A current industry example similarly uses 900 visitors per day, ₹800 average spending and 240 operating days to illustrate ₹17.28 crore of annual revenue before additional revenue streams.
Main Revenue Sources of a Water Park
A profitable water park normally has multiple revenue streams.
- Entry Tickets
Entry tickets are usually the primary source of revenue.
Ticket pricing may vary according to:
- Weekdays
- Weekends
- Peak season
- Off-season
- Adults
- Children
- Group bookings
- Special packages
Dynamic pricing and seasonal offers can help improve visitor utilization.
- Food and Beverages
Food and beverages can become an important secondary revenue source.
A park may operate:
- Restaurants
- Food courts
- Snack counters
- Cafés
- Ice-cream outlets
- Beverage counters
Increasing the average amount spent by each visitor can have a significant effect on total revenue.
- Lockers
Visitors generally need secure storage for their belongings.
Locker charges can therefore provide an additional source of revenue.
- Parking
Large water parks can charge separately for parking.
While parking revenue may be relatively small compared with ticket revenue, high visitor volumes can make it meaningful.
- Events and Group Bookings
Additional revenue can come from:
- Corporate outings
- School trips
- College groups
- Birthday parties
- Private events
- Family functions
These activities can also help generate visitors on weekdays.
- Merchandise
Depending on the park, merchandise may include:
- Swimwear
- Towels
- Caps
- Water bottles
- Toys
- Souvenirs
- Branded products
- Premium Facilities
Some parks can charge separately for:
- Cabanas
- Premium seating
- Private areas
- Special experiences
- VIP facilities
The objective is to increase average revenue per visitor, not simply increase the entry price.
Water Park Profit Margin
Profit margin is the percentage of revenue that remains after expenses.
The basic formula is:
Profit Margin = Profit ÷ Revenue × 100
For example, if a water park generates:
Revenue = ₹20 crore
and:
Net Profit = ₹5 crore
then:
Net Profit Margin = ₹5 crore ÷ ₹20 crore × 100
= 25%
A 25% net margin would mean that the business retains ₹25 as net profit for every ₹100 of revenue, after the expenses included in the calculation.
Published Indian industry estimates currently cite 22%–30% net margins for well-managed water parks, but actual results can vary substantially.
EBITDA Margin vs Net Profit Margin
These two numbers should not be confused.
EBITDA Margin
EBITDA is earnings before interest, taxes, depreciation and amortization.
It gives an indication of the operating performance of the business before financing, tax and certain non-cash expenses.
Net Profit Margin
Net profit is what remains after relevant operating expenses, depreciation, interest, taxes and other applicable expenses.
Therefore:
EBITDA Margin > Net Profit Margin
in many cases.
A current Indian industry source estimates EBITDA margins of approximately 30%–40% for water parks under favourable conditions.
Major Expenses That Reduce Profit
Water park revenue can look impressive, but operating costs can also be substantial.
Major expenses include:
Employee Costs
Staff may include:
- Lifeguards
- Ride operators
- Security personnel
- Cleaning staff
- Maintenance technicians
- Ticketing staff
- Managers
- Food-service employees
Electricity
Water parks can have significant electricity consumption because of:
- Pumps
- Filtration systems
- Water treatment
- Lighting
- Air conditioning
- Kitchen equipment
Water Treatment
Water treatment requires:
- Chemicals
- Filtration
- Testing
- Pumping
- Cleaning
- Regular maintenance
Maintenance
Rides and water systems require regular inspection and maintenance.
Expenses may include:
- Spare parts
- Pump maintenance
- Slide repairs
- Pool maintenance
- Electrical repairs
- Equipment replacement
Marketing
Marketing expenditure may include:
- Digital advertising
- Social media
- Outdoor advertising
- Influencer marketing
- Promotional offers
- Local campaigns
Insurance and Safety
Safety-related expenses should not be minimized simply to improve margins.
The park may require investment in:
- Lifeguards
- Rescue equipment
- First-aid facilities
- CCTV
- Emergency systems
- Safety training
- Insurance
Illustrative Water Park Profit Calculation
Consider the following hypothetical example:
Annual Revenue: ₹24 crore
Suppose annual operating expenses are:
| Expense | Amount |
| Salaries & staff | ₹3.0 crore |
| Electricity & utilities | ₹2.0 crore |
| Maintenance | ₹1.5 crore |
| Marketing | ₹1.0 crore |
| Water treatment & chemicals | ₹0.8 crore |
| Food & operating costs | ₹2.0 crore |
| Security & safety | ₹0.7 crore |
| Administration & other costs | ₹1.0 crore |
| Total | ₹12.0 crore |
Illustrative operating profit:
₹24 crore − ₹12 crore = ₹12 crore
Operating margin:
₹12 crore ÷ ₹24 crore × 100 = 50%
However, this should not be treated as a realistic guaranteed net margin. Depreciation, interest, taxes, land-related expenses, replacement expenditure and other costs could substantially reduce the final profit.
This example simply demonstrates how the calculation works.
A More Conservative Profit Model
Suppose the same park generates:
Revenue = ₹24 crore
and after all operating and other relevant expenses, the business produces:
Net Profit = ₹5 crore
Then:
Net Profit Margin = 20.8%
This is much closer to the range of profitability sometimes discussed in industry estimates, but even this should not be assumed without a site-specific feasibility study.
How to Calculate ROI for a Water Park
ROI stands for Return on Investment.
The basic formula is:
ROI = Annual Profit ÷ Total Investment × 100
Suppose:
Total Investment = ₹25 crore
and:
Annual Profit = ₹5 crore
Then:
ROI = ₹5 crore ÷ ₹25 crore × 100
= 20%
This means the annual profit represents 20% of the original investment under this simplified calculation.
However, professional investment analysis should also consider the timing of cash flows, debt, interest, taxes, depreciation, maintenance capital expenditure and residual asset value.
Water Park Payback Period
Payback period tells you approximately how long it takes to recover the initial investment.
For example:
Initial Investment = ₹25 crore
Annual Cash Generation = ₹5 crore
Simple payback:
₹25 crore ÷ ₹5 crore = 5 years
Therefore, the simplified payback period would be approximately 5 years.
But actual payback can take longer because visitor numbers may be lower during the initial years and because cash flow varies seasonally.
Current industry sources cite payback estimates ranging from roughly 5–9 years, illustrating how strongly the result depends on the project assumptions.
Break-Even Point
Break-even is another important financial metric.
It represents the level at which revenue covers the relevant costs.
For example, suppose:
Annual fixed costs = ₹8 crore
and:
Average contribution per visitor = ₹400
Then:
Break-even visitors = ₹8 crore ÷ ₹400
= 2,00,000 visitors
The park would therefore need approximately 2 lakh visitors under these assumptions to cover those costs.
Actual break-even calculations should include the park’s fixed costs, variable costs and non-ticket revenue.
Published Indian project reports show how widely break-even assumptions can vary. One 5-acre water-park project report lists a 68% break-even point, while a separate amusement-park-cum-water-park project lists 78%.
Seasonality Can Change Profitability
Seasonality is one of the biggest factors affecting water park profitability in India.
Revenue may be concentrated around:
- Summer vacations
- Weekends
- Public holidays
- School holidays
- Festival periods
During the off-season, visitor numbers may fall sharply.
Therefore, calculating annual revenue by simply multiplying peak-season visitors by 365 days can produce an unrealistic business plan.
A better model divides the year into:
Peak Season → Shoulder Season → Off Season
and estimates visitor numbers separately for each period.
What Determines Water Park Profit Margin?
The most important factors are:
Location
A park near a large population center or strong tourist route can potentially generate higher footfall.
Ticket Pricing
Higher pricing can increase revenue per visitor, but excessive pricing can reduce demand.
Visitor Footfall
A park’s profitability is strongly connected to annual visitors and capacity utilization.
Average Spending Per Visitor
Food, lockers, parking and merchandise can increase revenue without relying exclusively on ticket prices.
Operating Efficiency
Efficient pumps, filtration, staffing and maintenance can reduce unnecessary costs.
Seasonality
A park must generate enough peak-season revenue to support the business during weaker periods.
Debt
A heavily financed project can have a substantially lower net profit after interest expenses.
Can a Water Park Have a 30% Profit Margin?
It is possible, but it should not be assumed.
A current industry source cites 22%–30% net margins for well-managed water parks, while another estimates 30%–40% EBITDA margins.
These are industry-level estimates rather than guarantees for a new park.
A newly established water park may have lower margins initially because of:
- High marketing costs
- Lower initial footfall
- Staff training
- Launch expenses
- Interest costs
- Maintenance
- Depreciation
- Ramp-up period
A mature park with strong visitor demand may perform considerably better.
Real-World Example: Why ROI Can Differ
Current financial results from a listed Indian leisure operator illustrate why revenue growth does not automatically translate into the same level of profit growth.
Imagicaa World reported FY26 revenue from operations of ₹373.9 crore and EBITDA of ₹116.0 crore, giving an EBITDA margin of about 31%; however, profit after tax was only ₹0.6 crore, or roughly 0.2%, after depreciation, finance costs and taxes. The company said FY26 figures included its Indore Water Park.
This is an important lesson for water-park investors:
High operating margins do not necessarily mean high final net profits.
Depreciation, financing and other expenses can significantly affect the bottom line.
How to Improve Water Park Profitability
A water park can improve profitability through several strategies.
Increase Revenue Per Visitor
Instead of depending entirely on ticket prices, increase spending through:
- Food
- Lockers
- Parking
- Merchandise
- Premium facilities
- Events
Improve Weekday Footfall
Corporate packages, school trips and group discounts can help increase weekday utilization.
Control Energy Costs
Efficient pumps, filtration systems and electrical equipment can reduce operating expenses.
Reduce Water Loss
Effective water management and treatment systems can reduce unnecessary water consumption and treatment costs.
Encourage Repeat Visits
Season passes, memberships and loyalty programs can generate repeat customers.
Use Seasonal Pricing
Higher pricing during peak demand and promotional pricing during slower periods can improve capacity utilization.
Final Conclusion
The profit margin of a water park in India cannot be represented by one fixed percentage.
Current industry estimates suggest that a well-managed water park may achieve around 22%–30% net margins under favourable assumptions, while EBITDA margins can be higher. However, actual profitability depends on the project’s location, investment size, visitor footfall, ticket pricing, operating expenses, seasonality and financing structure.
For investors, the most important numbers to calculate before starting a project are:
Total Investment → Annual Visitors → Average Revenue Per Visitor → Total Revenue → Operating Expenses → EBITDA → Net Profit → ROI → Break-Even → Payback Period
A detailed feasibility study should therefore be prepared using the actual land cost, project capacity, local competition, expected visitor catchment, ticket pricing and financing structure rather than relying on a generic profit percentage.
A water park can be a profitable business, but high revenue does not automatically mean high net profit. The quality of the financial model and the accuracy of visitor projections ultimately determine whether the project can deliver an attractive return.